Tariff rates by country in 2026, and how to read them
2026-10-05 · 56 min read · Portolan
What every major economy charges, what the United States really collects on each partner's goods, and why one country can have five different tariff rates at once
In September 2026 the United States collected duties worth 6.49% of everything it imported, almost three times its 2024 rate, while the World Trade Organization's database still lists the US trade-weighted tariff at 2.2%.
Both numbers are correct. The first comes from the US Census Bureau, which records the duty calculated on every shipment entering the country alongside the value of the goods - US Census Bureau. The second comes from the WTO's tariff statistics, which average the rates written into each member's published tariff schedule - WTO Stats. They answer different questions, and in 2026 the gap between them is the widest it has ever been, because most of the new American duties are levied outside the schedule the WTO reads.
Search for "tariff rates by country" and the same confusion follows every economy. India is quoted at 16% in one table and under 8% in another. Korea is 13.5% or 8%, China 7.5% or 3%. None of these is a typo. Each is a different, legitimate way of turning thousands of product-level duties into one figure, and the choice of method can move the answer by a factor of three. Read the wrong one and a closed market looks open, or a tariff wall looks like a rounding error.
This guide does three things. It explains the five measures that all get called "the tariff rate" and what each one is actually good for. It gives the real numbers for more than 35 economies, pulled on October 5, 2026 directly from the WTO's tariff database and the US Census Bureau's trade API, the same sources that color the tariff layer of the Portolan map. And it walks through the 2026 American tariff regime, rebuilt statute by statute after the Supreme Court struck down the emergency tariffs in February, together with what each major partner's goods actually paid at the border. For the wider picture of trade corridors and shipping lanes, our overview of world trade in 2026 is the companion piece.
Contents
- Five numbers called "the tariff rate"
- Tariff rates by country: the 2025 table
- Why farm tariffs dominate the averages
- The United States in 2026: a tariff wall rebuilt after the Supreme Court
- US tariffs by country: what each partner's goods actually paid
- What the rest of the world charges in 2026
- How to find the tariff on one product
- Seven traps in tariff data
- How Portolan measures tariffs and keeps them current
- What to watch through early 2027
- Which number to use: a decision framework
1. Five numbers called "the tariff rate"
Start from the object itself. A country's tariff is not one number but a schedule: a list of product lines, each identified by a Harmonized System code and each carrying its own duty. The Harmonized System that customs authorities share worldwide divides goods into more than 5,000 six-digit subheadings (the edition taking effect in 2028 has 5,852) - World Customs Organization, and national schedules split those subheadings further, to eight or ten digits, with a rate on every line. A rate "for India" or "for the United States" is therefore always a summary of thousands of separate duties, and there are several defensible ways to summarize them. Each method answers a different question, which is why careful sources always say which one they used and careless ones never do.
The first fork is legal. Almost every WTO member has a bound rate on most of its lines: a ceiling that, in the WTO's words, "may not be raised without compensating the affected parties" - WTO glossary. Below that ceiling sits the MFN applied rate, the duty a country actually charges imports from any WTO member it has no special agreement with. The space between the two, which trade economists call "water" or binding overhang, is room a government can use to raise tariffs without breaking a WTO commitment. India's bound rates average 50.8% against an applied average of 16.0%, while the US bound average of 3.4% sits almost on top of its applied 3.3% - WTO Stats.
The second fork is arithmetic. A simple average gives every tariff line equal weight, so a 30% duty on a product the country barely imports counts as much as a zero duty on its largest import. A trade-weighted average weights each line by the value actually imported, which sounds more realistic but carries a built-in bias: a duty high enough to choke off imports gets almost no weight, because the imports it blocks never happen; the WTO and UNCTAD's own guide notes that weighted averages "would give zero weight to prohibitive tariffs" - WTO and UNCTAD. The simple average overstates the burden on the trade that actually takes place; the weighted average understates how protected a market really is.
The third fork is who the importer is buying from. The MFN rate is only the default. Goods from free-trade partners, and from developing countries covered by preference schemes, often pay less and frequently nothing at all. The World Bank's effectively applied rate takes, for each product and partner, the lowest duty actually available, preferences included, and then weights the result by trade - World Bank WITS. For an economy with a dense web of trade agreements the difference is large: Chile's MFN schedule is a flat 6%, yet its effectively applied rate in 2022 was 0.46%, and Mexico's was 1.62% - World Bank.
The last two measures leave the schedule entirely. Duties collected divided by the value of imports is what customs actually took in, after every exemption, preference, quota and special duty. It is the only measure that captures tariffs imposed outside the normal schedule, such as American national-security and retaliation duties, and it responds to behavior: when importers move away from a heavily taxed supplier, the collected rate falls even if no statutory rate changes. Forecasters add a fifth variant, a statutory effective rate, which applies the rates currently in force to a fixed basket of earlier imports, before and after importers adjust, a distinction the Yale Budget Lab calls "a crucial one" - Yale Budget Lab.
The same two economies read very differently depending on which branch of that tree you stand on. The table below puts one high-tariff and one low-tariff economy through every measure, using the latest year each source has published. Notice that the US row only becomes interesting at the bottom, while India's is interesting at the top.
| Measure | What it answers | Source | United States | India |
|---|---|---|---|---|
| Bound, simple average | How high could tariffs legally go? | WTO | 3.4% | 50.8% |
| MFN applied, simple average | What does the schedule say, line by line? | WTO | 3.3% (2025) | 16.0% (2025) |
| MFN applied, trade-weighted | What does the schedule charge on actual imports? | WTO | 2.2% (2025) | 7.9% (2025) |
| Effectively applied, weighted | What is paid once trade deals count? | World Bank | 1.49% (2022) | 4.59% (2022) |
| Duties collected / imports | What did customs actually collect? | US Census Bureau | 2.78% (2022), 7.65% (2025) | not in this series |
The 2022 column is the cleanest illustration of why the bottom row exists. That year the World Bank measured the United States' effectively applied tariff at 1.49% - World Bank, while US customs actually collected 2.78% of the value of imports. The difference is the Section 301 duties on Chinese goods and the Section 232 duties on steel and aluminum, which are levied through a special chapter of the US schedule that schedule-based measures never read. In 2025, when those extra layers multiplied, the gap became a chasm: a schedule rate of about 2% against a collected rate of 7.65%.
Why this matters is simple: every argument about tariffs, from "the US is one of the most open markets in the world" to "the US now has the highest tariffs in a century", can be supported with a real number by picking the measure that suits it. How to apply it is equally simple. Before using any tariff figure, ask which of the five it is, which year it describes, and whether it reads the schedule or the border. The rest of this guide labels every number accordingly.
2. Tariff rates by country: the 2025 table
The table below is the reference most readers come looking for: the MFN applied tariff for 36 economies, as a simple average and as a trade-weighted average, alongside each economy's average bound rate. The figures come from the WTO's tariff statistics for 2025, the latest year in its database, retrieved on October 5, 2026 - WTO Stats. The European Union appears once because its 27 members share a single external tariff. The rows are sorted by simple average, highest first.
Read this table as a portrait of each country's published schedule, not of what its trading partners pay today. For most economies the two are close, because most of their trade either pays the MFN rate or enters under a trade agreement at a lower one. For the United States in 2025 and 2026 they are far apart, which is the subject of sections 4 and 5. The bound column is a simple average of bound lines, and several developing economies bind only part of their schedule: Bangladesh has bound rates in just 17.6% of its six-digit subheadings and India in 74.3%. The WTO itself warns that comparing bound and applied averages "is only valid in cases of full binding coverage" - WTO World Tariff Profiles 2026, so treat those bound figures as a description of the bound lines rather than the whole tariff.
| Economy | Simple average | Trade-weighted | Bound average |
|---|---|---|---|
| Türkiye | 17.3% | 9.8% | 28.9% |
| India | 16.0% | 7.9% | 50.8% |
| Kenya | 15.2% | 13.0% | 93.9% |
| Bangladesh | 14.1% | n/a | 155.1% |
| Korea, Republic of | 13.5% | 8.0% | 18.2% |
| Argentina | 12.4% | 12.3% | 31.8% |
| Brazil | 12.0% | 9.4% | 31.3% |
| Nigeria (2024) | 12.0% | 8.5% | 120.0% |
| Thailand | 9.9% | 6.2% | 26.6% |
| Viet Nam | 9.5% | 5.1% | 11.7% |
| Pakistan | 9.5% | 6.7% | 60.9% |
| Mexico | 8.5% | 5.6% | 36.2% |
| Indonesia | 8.0% | 5.7% | 37.1% |
| South Africa | 7.6% | 5.9% | 19.0% |
| China | 7.5% | 3.0% | 10.0% |
| Colombia | 6.8% | 6.9% | 41.7% |
| Russia | 6.6% | 5.3% (2023) | 7.6% |
| Chinese Taipei | 6.3% | 1.8% | 6.7% |
| Chile | 6.0% | 6.0% | 25.1% |
| Saudi Arabia | 5.9% | 5.4% | 11.0% |
| Philippines | 5.9% | 5.5% | 24.9% |
| Malaysia | 5.5% | 3.3% | 20.8% |
| European Union | 4.9% | 2.9% | 4.8% |
| United Arab Emirates | 4.8% | 3.4% | 14.4% |
| Norway | 4.4% | 2.1% | 22.2% |
| Switzerland | 3.9% | 1.1% | 7.0% |
| Japan | 3.7% | 2.0% | 4.0% |
| Canada | 3.7% | 3.6% | 6.5% |
| United Kingdom | 3.7% | 3.4% | 5.0% |
| United States | 3.3% | 2.2% | 3.4% |
| Peru | 2.3% | 1.7% | 29.6% |
| Australia | 2.1% | 2.5% | 9.4% |
| New Zealand | 1.9% | 2.3% | 9.5% |
| Israel | 1.1% | 1.3% | 22.5% |
| Singapore | 0.0% | 0.0% | 8.9% |
| Hong Kong, China | 0.0% | 0.0% | 0.0% |
Three patterns stand out. The first is the customs unions, whose members, in the WTO's definition, "apply a common external tariff" - WTO glossary. That is why the European Union appears as one row: Germany, France, Italy and the other 24 member states all charge the same 4.9% simple average, because the external tariff is set for the union as a whole. Comparing two members of one customs union compares one schedule with itself, so a ranking that lists EU member states separately is padding its length, not adding information.
The second is the gap between the simple and the weighted average, which says something about what each economy buys. China's simple average of 7.5% falls to 3.0% once weighted by trade, and the WTO's own tables show why: only 10.2% of China's non-agricultural tariff lines are duty-free, yet 64.2% of its non-agricultural imports by value enter duty-free - WTO World Tariff Profiles 2026. Its imports are concentrated in the few lines it barely taxes. Chinese Taipei's weighted rate of 1.8% has the same cause in stronger form, with 78.8% of its non-agricultural imports entering duty-free. Where the two averages are identical, as in Chile at 6.0% on both measures, the schedule is flat: almost every Chilean line, farm or industrial, carries the same 6% duty, so weighting cannot change the answer.
The third is the handful of economies that charge almost nothing. Singapore and Hong Kong are free ports with zero MFN duties on nearly every line. Switzerland now charges nothing on industrial goods: its non-agricultural average is 0.0%, with 98.9% of those lines duty-free and 99.9% of its non-agricultural imports entering free - WTO World Tariff Profiles 2026. Its overall averages are therefore carried entirely by agriculture, the subject of the next section. Australia shows the rare case of a weighted average above its simple one (2.5% against 2.1%): almost every remaining Australian duty is 5% or less, but the dutiable lines account for a larger share of what it imports than of its schedule, so weighting by trade raises the average instead of lowering it.
How to use the table depends on the question. If you are asking how protective a country's tariff policy is, start with the simple average and the bound average, because they describe the policy rather than the trade it has already shaped. If you are estimating what a typical shipment into that market pays today, start with the trade-weighted average and then check whether your origin has a trade agreement, which can take the rate to zero. Every economy in the table can be opened on the Portolan map, where its tariff history runs back as far as its sources report it, to 1988 at the earliest; India's record is a good example of how far the measures can drift apart over time.
3. Why farm tariffs dominate the averages
Split any schedule into agricultural and non-agricultural products and a second, sharper picture appears. For most rich economies, tariffs on manufactured goods are now low, typically between zero and four percent on average. The protection that remains is concentrated in food: dairy, rice, sugar, meat and grains. Because a simple average counts every tariff line equally, a few hundred very high farm lines can carry a country's whole headline number, which is why a country can look protectionist in a league table while charging almost nothing on the cars, machinery and electronics that make up most of world trade.
The extremes are striking. Korea's simple average on agricultural products is 57.0%, against 6.6% on everything else - WTO Stats. Switzerland charges 28.3% on agricultural lines and nothing on industrial ones. Norway is at 29.9% against 0.4%. Even Canada, one of the most open economies in the table, averages 14.5% on farm goods against 2.0% elsewhere, a gap driven by a handful of very high lines: Canada's dairy tariffs average 214.1%, with a maximum of 354% - WTO World Tariff Profiles 2026. The most famous single line is Korea's rice tariff: when Korea opened its rice market on January 1, 2015, after two decades of delay allowed under its Uruguay Round commitments, it set the duty at 513%, with a quota of rice still entering at 5% - Korea Times.
The reason farm tariffs look so high is historical and mechanical. Before the Uruguay Round agreements that created the WTO, much farm protection took the form of quotas and variable levies rather than tariffs. The Agreement on Agriculture required members to convert those barriers into tariffs, a process called tariffication, and many countries set the new tariffs at levels that reproduced the old protection; the WTO defines tariffication as the procedure "by which non-tariff measures were converted into equivalent tariffs" - WTO glossary. Those conversions produced the triple-digit rates still visible today, usually paired with tariff-rate quotas: a set volume enters at a low in-quota duty, and anything above it pays the prohibitive out-of-quota rate. On top of that, many farm duties are specific (a fixed amount per kilogram or liter) rather than a percentage, and have to be converted into ad valorem equivalents before they can be averaged at all, a conversion that moves with world prices, and a specific duty bites hardest on the cheapest goods, since a fixed amount per unit "is stiffer as a proportion of price for a lower-priced good" - WTO and UNCTAD.
The practical lesson is to split before you compare. If your interest is manufactured goods, which is most of world trade by value, use the non-agricultural average: on that measure Korea's 13.5% headline becomes 6.6%, India's 16.0% becomes 12.8%, and Switzerland is a zero-tariff economy. If your interest is food, look past the average entirely, at the specific product line and its quota, because an average of in-quota and out-of-quota rates describes no shipment that ever crossed a border. This matters in 2026 for a concrete reason: the bitterest bilateral dispute of the year, between the United States and Canada, is partly a fight over these farm schedules, since dairy is one of the three Canadian policies the US Section 338 duties answer, as the next section shows.
4. The United States in 2026: a tariff wall rebuilt after the Supreme Court
No economy's tariff has moved like the American one, and no economy's tariff matters as much: the United States imported $3.39 trillion of goods for consumption in 2025 - US Census Bureau, and a duty set in Washington reprices sourcing decisions on every continent. Understanding what the US charges in October 2026 requires one historical fact above all others: the tariffs that defined 2025 are gone, struck down in February, and the wall standing today was rebuilt from different legal bricks in the months since. The rebuild changed not just the rates but their shape, from a few country-wide numbers to a matrix of products, countries and statutes.
The 2025 wall was built mostly on the International Emergency Economic Powers Act (IEEPA). It began in February 2025 with tariffs on Canada, Mexico and China justified by fentanyl and border concerns - White House, widened on April 2 into a 10% baseline on nearly every country plus higher "reciprocal" rates, and peaked at an additional 145% on Chinese goods that April - China Briefing. Through the summer, bilateral deals replaced many of the April rates: 10% for the United Kingdom - White House, an all-in ceiling of 15% for most EU goods - CNBC, and 20% for Vietnam - CNBC. In August 2025 the Federal Circuit ruled 7 to 4 that the IEEPA tariffs exceeded the statute's authority but left them in place pending appeal - US Court of Appeals for the Federal Circuit.
On February 20, 2026 the Supreme Court settled the question. In Learning Resources, Inc. v. Trump, decided together with Trump v. V.O.S. Selections, the Court held 6 to 3 that "IEEPA does not authorize the President to impose tariffs", in an opinion by Chief Justice Roberts - Supreme Court of the United States. Customs stopped collecting the IEEPA duties on goods entered from 12:00 a.m. on February 24 - US Customs and Border Protection, and an executive order formally ended the reciprocal, fentanyl and secondary-tariff orders - Federal Register. PBS NewsHour's same-day explainer, with SCOTUSblog co-founder Amy Howe, covers both the reasoning and the replacement tariff announced within hours.
The replacement came the same day. Proclamation 11012 imposed a temporary 10% surcharge on nearly all imports under Section 122 of the Trade Act of 1974, a balance-of-payments provision capped by statute at 15% and 150 days, with goods entering duty-free from Canada and Mexico under the USMCA exempted - Federal Register. The Court of International Trade held the surcharge unlawful in May, but only for the three plaintiffs before it - US Court of International Trade, and the Federal Circuit stayed even that while the appeal proceeds. The surcharge simply ran out its clock, expiring at 12:01 a.m. on July 24, 2026 - US Customs and Border Protection.
At that same minute a new layer took over. After investigating 60 economies for failing to enforce bans on goods made with forced labor, the US Trade Representative imposed duties under Section 301 in three tiers - Federal Register. Seventeen economies pay a flat 10%, among them Canada, Mexico, India, Indonesia, Bangladesh, Cambodia, Pakistan and the United Kingdom. Goods from the EU and Taiwan pay whatever tops their MFN duty up to 10%, and goods from Japan, Korea and Switzerland are topped up to 12.5%, so a product whose MFN rate already exceeds the cap pays no Section 301 duty at all. The remaining 38 economies, including China, Brazil, Vietnam, Australia and Singapore, pay a flat 12.5%. Products covered by Section 232 are exempt, and so are Canadian and Mexican goods entered duty-free under the USMCA. A challenge to the whole action, In re Section 301 Forced Labor Cases, was argued before the Court of International Trade on September 30 - Trade Law Daily, and no ruling has been published.
Underneath the country tiers sits the product layer, which survived the Supreme Court untouched because it rests on a different statute. Section 232 of the Trade Expansion Act lets the President tax imports that the Commerce Department finds threaten national security, and since 2025 it has spread from metals to most heavy industry. In April 2026 the metals duties were restructured to apply to the full customs value of covered goods rather than their metal content, at 50% for the main list - Federal Register. Patented pharmaceuticals face a default of 100%, with 15% for the EU, Japan, Korea and Switzerland, 20% for companies with approved plans to move production to the United States, and generics excluded - Federal Register. Not every announced duty is in force: the polysilicon tariff and its minimum import prices were proclaimed in August but only apply from December 4, 2026 - Federal Register.
| Layer | Legal basis | Rate in October 2026 | Applies to | In force since |
|---|---|---|---|---|
| MFN schedule | Tariff Act of 1930, HTSUS column 1 | 0% to over 30% by line, 3.3% simple average | All WTO members without a trade agreement | Permanent |
| Forced-labor duties | Trade Act of 1974, Section 301 | 10% or 12.5%; capped at 10% (EU, Taiwan) or 12.5% (Japan, Korea, Switzerland) including MFN | 60 economies; not Section 232 goods or duty-free USMCA goods | July 24, 2026 |
| China duties | Section 301 | 7.5% or 25% by list; 50% to 100% on EVs, chips, solar cells and others | Goods of China | 2018 to 2019, raised from 2024 |
| Brazil duties | Section 301 | 25% on covered goods | Goods of Brazil, with exemptions | July 20, 2026 |
| Metals | Trade Expansion Act of 1962, Section 232 | 50% of full value on the main list, 25% on others | Steel, aluminum, copper and derivatives | 2018, restructured April 6, 2026 |
| Vehicles | Section 232 | 25%; 15% all-in for the EU, Japan and Korea | Cars, light trucks, parts | April and May 2025 |
| Other sectors | Section 232 | 10% to 100% | Trucks, buses, lumber, furniture, chips, patented drugs, drones | October 2025 to September 2026 |
| Canada duties | Tariff Act of 1930, Section 338 | 50%; import bans on some goods | Listed Canadian goods | August 22, 2026; bans September 29 |
Two layers in that table are worth singling out because they are unusual even by 2026 standards. Section 338 of the 1930 Tariff Act, which lets the President retaliate against discrimination by a foreign country, had never been used in the modern era until July 2026, when three proclamations put 50% on listed Canadian alcohol, dairy and motor-vehicle goods - Federal Register. In September the dispute escalated to outright import bans on certain Canadian alcoholic beverages, dairy products, molasses and motorcycles, effective September 29 - Federal Register. A ban is the limit case of a tariff: a rate so high that no measure built on collected duties will ever register it.
The other is the bill for the layer that disappeared. Customs and Border Protection estimates that the IEEPA tariffs assessed between February 3, 2025 and February 24, 2026 "total an estimated $166 billion, with over 53 million entry summaries requiring processing" - Federal Register. Refunds began flowing through a new CBP system in the spring, and they were large enough to turn the Treasury's net customs receipts negative in May, June and July 2026; in June alone refunds of $49.2 billion exceeded gross collections of $23.6 billion - US Treasury. Duty-free treatment of low-value parcels, suspended in 2025, was not restored by the ruling: CBP made the suspension indefinite by rule, and a 2025 statute repeals the exemption outright from July 1, 2027 - Public Law 119-21.
Why this matters is that "the US tariff on country X" no longer has a single answer. A German car pays 15% all-in, German steel on the main metals list pays 50% of its full value, a German industrial machine pays its MFN rate topped up to 10%, and a German patented medicine pays 15% unless its maker has a pricing agreement. A Canadian product entered duty-free under the USMCA pays no forced-labor duty, while the same product shipped outside the agreement pays 10%. How to apply it: never quote a country rate for the United States without naming the product, and when you need a single number per partner, use the one that integrates all of this automatically, which is what customs actually collected. That is the next section.
5. US tariffs by country: what each partner's goods actually paid
The cleanest answer to "what tariff does the US charge on goods from country X" comes from dividing the duty calculated on that country's goods by their customs value. The Census Bureau publishes both figures every month for every partner, so the ratio can be computed for any country and any period; it automatically integrates every layer described above, every exemption and every trade-agreement preference, weighted by what was actually shipped. The table below does that for 24 partners, for 2024 (before the new tariffs), for 2025, for the first seven months of 2026 and for July 2026, the latest month published as of this writing - US Census Bureau.
These are collected rates, so they move when importers change behavior as well as when the law changes. A partner whose exporters shifted toward duty-free products or USMCA-qualifying parts shows a lower rate even if no statute changed. The 2025 column also still contains the IEEPA duties that are now being refunded, which is why it overstates what importers will ultimately have paid for that year.
| Partner | US imports 2025 | Duty rate 2024 | Duty rate 2025 | Jan to Jul 2026 | July 2026 |
|---|---|---|---|---|---|
| All countries | $3,391.2B | 2.36% | 7.65% | 7.35% | 6.45% |
| China | $299.8B | 10.93% | 30.60% | 24.33% | 21.40% |
| Bangladesh | $9.6B | 15.06% | 23.30% | 25.96% | 22.99% |
| Cambodia | $15.4B | 7.02% | 17.88% | 22.61% | 19.98% |
| Pakistan | $5.5B | 9.59% | 18.38% | 21.21% | 19.28% |
| Indonesia | $34.7B | 4.88% | 12.74% | 16.26% | 13.66% |
| Türkiye | $16.5B | 3.32% | 11.57% | 14.01% | 12.11% |
| Brazil | $39.9B | 1.28% | 9.13% | 11.73% | 9.76% |
| Japan | $144.3B | 1.52% | 10.89% | 11.03% | 10.58% |
| India | $104.1B | 2.41% | 9.53% | 10.84% | 8.15% |
| Germany | $156.4B | 1.38% | 7.87% | 9.61% | 8.80% |
| Korea, South | $123.7B | 0.19% | 8.30% | 8.38% | 7.62% |
| European Union | $626.6B | 1.23% | 5.58% | 7.87% | 7.19% |
| Vietnam | $198.1B | 3.81% | 8.73% | 7.86% | 6.18% |
| Thailand | $90.8B | 1.63% | 6.56% | 6.17% | 4.72% |
| United Kingdom | $65.5B | 0.95% | 4.78% | 6.19% | 6.34% |
| Switzerland | $106.1B | 0.59% | 2.26% | 4.88% | 4.37% |
| Malaysia | $57.6B | 0.69% | 5.35% | 4.62% | 3.77% |
| Australia | $28.9B | 0.11% | 2.80% | 3.90% | 3.63% |
| Mexico | $533.3B | 0.24% | 3.67% | 3.51% | 2.90% |
| Canada | $382.0B | 0.10% | 2.61% | 3.05% | 2.82% |
| Taiwan | $198.2B | 0.94% | 2.86% | 2.61% | 1.99% |
| Singapore | $36.1B | 0.08% | 1.66% | 1.95% | 1.51% |
| Ireland | $128.4B | 0.18% | 0.61% | 1.49% | 1.26% |
Start with the headline. Across all partners the US collected 7.65% of import value in 2025, against 2.36% in 2024 and 1.42% in 2017, before the first trade war began. The monthly rate peaked at 10.84% in October 2025, held near 9% to 10% until the Supreme Court ruling, and has run between 6.45% and 6.89% every month since March 2026. In other words, the ruling cut the collected rate by about a third, and the replacement layers have held it close to three times its 2024 level. That matches the independent estimates: the Tax Foundation puts the 2025 rate at 7.7%, "the highest rate since 1947", and expects 7.2% for calendar 2026 - Tax Foundation, while the Penn Wharton Budget Model measured 7.1% in June 2026 - Penn Wharton Budget Model.
Statutory measures run higher, and the difference is itself informative. The Yale Budget Lab's tracker, which applies the rates in force to a fixed basket of imports, put the average statutory tariff at 11.0% in late August 2026, "roughly where it settled after Section 122 tariffs expired on July 24th and were replaced with new tariffs under Section 301" - Yale Budget Lab. A statutory rate near 11% beside collected rates of 6.5% to 6.9% in every month since March means that exemptions, preferences and importers' choices are absorbing roughly two-fifths of the headline tariff. Neither number is wrong; one describes the law and the other describes the trade that happened under it.
The chart also explains a figure that confuses many readers: the first trade war barely registers. The Section 301 duties on China and the 2018 metals tariffs lifted the collected rate from 1.42% to a peak of 2.96% in 2021, real but modest, because they covered a minority of imports and importers moved quickly to other suppliers. The 2025 jump was of a different order because the IEEPA layer touched almost every country at once. Even so, roughly three in five dollars of US imports still entered duty-free in 2025: dutiable imports were $1.33 trillion of $3.39 trillion, and the duty on those dutiable goods averaged 19.6%, a measure that shows how heavy the tariff is on the goods that actually pay it.
China is the obvious story and the most misunderstood one. Its goods paid 10.93% in 2024, already the highest of any large partner because of the first-round Section 301 duties, then 30.60% across 2025, with a monthly peak of 47.92% in May 2025. That peak is a third of the 145% statutory rate announced in April, for two reasons that recur in every tariff episode: large categories such as smartphones and computers were exempted within days, and imports of the most heavily taxed goods collapsed. US imports from China fell from $431.0 billion in 2024 to $299.8 billion in 2025. Since the ruling, Chinese goods have paid between 21% and 23% a month, well below the 35.2% average tariff in force that the Peterson Institute's tracker reported for Chinese goods on August 22, 2026 - PIIE. The gap between those two numbers is exemptions and substitution made visible: the law's rate applies to what China could sell, the collected rate to what it actually sold.
The least-known story is that the highest collected rates fall on poor countries that make clothes. Bangladesh paid 15.06% even in 2024, more than China, and 25.96% in the first seven months of 2026; Cambodia and Pakistan are above 20%. The reason is structural and predates every recent tariff: the US schedule has always taxed apparel and footwear far more heavily than machinery or electronics. Men's cotton T-shirts, for example, carry a general duty of 16.5% - US International Trade Commission, and the 2026 Section 301 duty of 10% for these three economies comes on top. Countries that export mostly clothing therefore face average duties several times higher than countries that export chips, even when their headline country rate is lower.
The rest of the ranking reads like a map of the Section 232 layer, which the same Census data can break down by product chapter. The United Arab Emirates ranks fifth because of aluminum: a quarter of its US shipments in January to July 2026, but 58% of the duty they paid, at an average rate of 42%. Slovakia ranks seventh because three-quarters of what it ships are vehicles, paying about 15%. Vehicles are also the largest single source of duty on Japan's goods, about a third of its shipments and nearly 40% of the duty. At the other end, Mexico (2.90% in July) and Canada (2.82%) pay little because most of their goods qualify for USMCA treatment and escape the country layers. Taiwan (1.99%) pays least among large partners because machinery and electronics, chiefly computers and chips, are about 90% of what it ships and pay well under 3%. Ireland paid 0.61% across 2025 and 1.49% so far in 2026; its medicines, half of its shipments, have paid almost nothing so far, because generics are excluded from the Section 232 medicine tariff and the tariff took effect for a listed group of companies on July 31 and for all others only on September 29, after these figures end - Federal Register.
One pattern needs care. The EU's collected rate is higher in 2026 (7.87% so far) than across 2025 (5.58%), which looks like an escalation but is mostly arithmetic: EU goods paid about 1% in January to March 2025, before any new tariff, and those quiet months pull the 2025 average down. Since June 2025 the monthly EU rate has stayed between 6.7% and 9.1%. The same caution applies to every annual comparison in the table: when a tariff starts or stops mid-year, compare months, not years. To see these partner relationships in context, the Portolan map draws each of the largest bilateral corridors with its value and opens a dossier for every economy; the United States dossier carries this collected-duty series back to 2010 together with the latest month.
6. What the rest of the world charges in 2026
The American story dominates the headlines, but it is not the only tariff story of 2026, and treating it as one hides the most important pattern of the year. The WTO estimates that the share of world trade conducted on MFN terms fell from about 80% at the start of 2025 to 72% by the end of February 2026, and that the tariff actions recorded by then affected roughly 11% of global trade - WTO. Most of that shift is American. But a second set of walls has gone up elsewhere, aimed less at the United States than at manufactured goods diverted from it.
Start with the countries that retaliated, because there are fewer of them than most readers assume. China keeps an additional 10% tariff on all American goods and has suspended a further 24% under the truce struck in November 2025; it did not change its countermeasures after the Supreme Court ruling - China Briefing. The farm tariffs it added in March 2025 were lifted that November, although US soybeans still face about 13% because the 10% layer remains - Transport Topics. Counting the older layers from 2018 and 2019 that were never removed, the Peterson Institute puts China's average tariff on US exports at 31.9%, covering every product - PIIE. In late September the two sides extended the truce to January 10, 2027 and approved reciprocal lists of about $30 billion of goods each, with about 90% of the listed products to return to MFN rates once each side completes its legal procedures - Global Times.
Canada is the other major retaliator, and its posture swings with the dispute. In September 2025 it removed most of its counter-tariffs on US goods that qualify under the USMCA (CUSMA in Canada) while keeping those on steel, aluminum and autos - Blakes. After the Section 338 tariffs, it imposed new counter-tariffs of 15%, 25% and 50% from September 8, 2026 on products covering C$27.6 billion of US imports, doubling the rate on steel and aluminum to 50% - Department of Finance Canada. Canada has simultaneously been cutting tariffs with China: since March 2026 Chinese tariffs on Canadian canola seed have fallen to a combined 14.9% from almost 85%, and Canada admits 49,000 Chinese electric vehicles a year at its 6.1% MFN rate instead of the 100% surtax - Global Affairs Canada, with permits for any vehicles beyond the quota simply unavailable - Cole International.
Others chose negotiation over retaliation. The European Union removed its tariffs on US industrial goods from July 1, 2026 as its side of the 2025 framework - Anadolu Agency, and on July 31 it extended, with no end date, the suspension of countermeasures it had prepared against about €93 billion of US goods - European Commission. Japan and Korea concluded deals rather than retaliating; Japan's included a $550 billion investment pledge in exchange for 15% US tariffs - CSIS. Brazil formally started its Reciprocity Law process against the US Section 301 tariff in August 2026, but no Brazilian tariff has been raised - InfoMoney. India has no retaliatory tariff in force, and its framework deal with the United States, announced in February, remains unfinished; India's finance minister said on October 5 that talks had "reached a plateau" - Business Today.
The second set of walls is the more consequential trend. Faced with Chinese steel, cars and consumer goods redirected away from the American market, other governments have raised barriers of their own, usually without naming China. Three of the largest took effect in 2026:
- Mexico raised its general tariffs on 1,463 tariff lines to between 5% and 50% from January 1, 2026, for goods from economies without a trade agreement with Mexico - Foley & Lardner, including a rise on Chinese light vehicles to 50% from 20% - Caixin.
- The EU replaced its steel safeguard on July 1, 2026 with duty-free quotas about 47% smaller and a 50% out-of-quota duty - European Commission.
- The United Kingdom cut its steel quota volumes by 51% and charges 50% above them, also from July 1, 2026 - UK Government.
Cars are the other front. The EU's countervailing duties on Chinese battery-electric cars range from 7.8% for Tesla to 35.3% for SAIC - Access2Markets, Brazil raised its import tariff on electric and hybrid cars to 35% from July 2026 - AMD Jus, and Türkiye has charged an extra 40% on Chinese cars since 2024 - VOA. China, for its part, applies new trade-defense measures of its own: from October 1, 2026 Brazilian beef beyond Brazil's quota pays an added 55% under China's beef safeguard - China Trade Remedies Information, taking its total duty to 67% - The Edge Malaysia.
Reading these measures together reveals a structure that no country-level average shows. The 2026 trading system is not a symmetric tariff war in which everyone raises duties on everyone. It is asymmetric: one large economy raised its tariffs sharply, most of its partners negotiated rather than retaliated, and almost everyone erected targeted walls against diverted manufacturing, especially steel and cars. That is why the MFN averages in section 2 barely moved for most economies while trade flows shifted dramatically. Mexico's MFN average in the WTO table, for example, predates its January 2026 increase, and its new tariffs fall only on partners without a trade agreement. How to apply this: when assessing access to a market other than the United States, check three things beyond the MFN schedule, namely trade-remedy duties on your product (anti-dumping, countervailing, safeguards), quota regimes for steel and farm goods, and whether your origin is covered by a preference. The EU adds a fourth: since January 1, 2026 its carbon border adjustment requires importers of steel, aluminum, cement, fertilizers, hydrogen and electricity to buy certificates for the emissions embedded in them - European Commission.
7. How to find the tariff on one product
Averages describe countries; businesses pay duties on products. If you are importing or exporting a specific good, every number in the earlier sections is context, and the figure that matters is the duty on your product's tariff line, from your origin, into your destination, on your date. Finding it is a five-step process that works for any country, and the steps are the same whether you are a trade analyst checking a claim or a small business pricing a shipment.
The process starts with classification, because every tariff schedule is organized by the Harmonized System, the World Customs Organization's product nomenclature. Its current seventh edition has applied since January 1, 2022 - World Customs Organization, and the next edition, accepted in January 2026 and taking effect on January 1, 2028, will have 5,852 six-digit subheadings - World Customs Organization. The first six digits are common worldwide; countries add their own digits beyond them. A wrong classification is the most expensive mistake in this process, because every later step depends on it, and in the United States a binding ruling on a product's classification can be searched in CBP's rulings database - US Customs and Border Protection.
The second step is to read the destination's schedule for that line. Each customs authority publishes its own: the US Harmonized Tariff Schedule from the US International Trade Commission - USITC, the EU's TARIC database - European Commission, the UK Trade Tariff - UK Government, Canada's Customs Tariff - Canada Border Services Agency, and Japan's tariff schedule - Japan Customs. To compare many markets at once, the WTO's Tariff & Trade Data portal covers more than 150 economies - WTO, and the World Bank's WITS system adds trade flows and non-tariff measures - World Bank WITS. The European Commission's Access2Markets tool goes further for EU trade, combining tariffs, rules of origin and requirements in one product search - Access2Markets.
The screenshot below shows what step two looks like in practice for a single product, men's and women's cotton T-shirts, in the US schedule. The General column is the MFN rate, 16.5%. The Special column lists the trade-agreement partners whose qualifying goods enter free, identified by codes such as AU for Australia, KR for Korea and SG for Singapore. The General column is defined as the normal trade relations rate, the American name for MFN, and column 2, at 90%, applies only to goods of Cuba, North Korea, Russia and Belarus - USITC.
One tariff line: cotton T-shirts in the US schedule
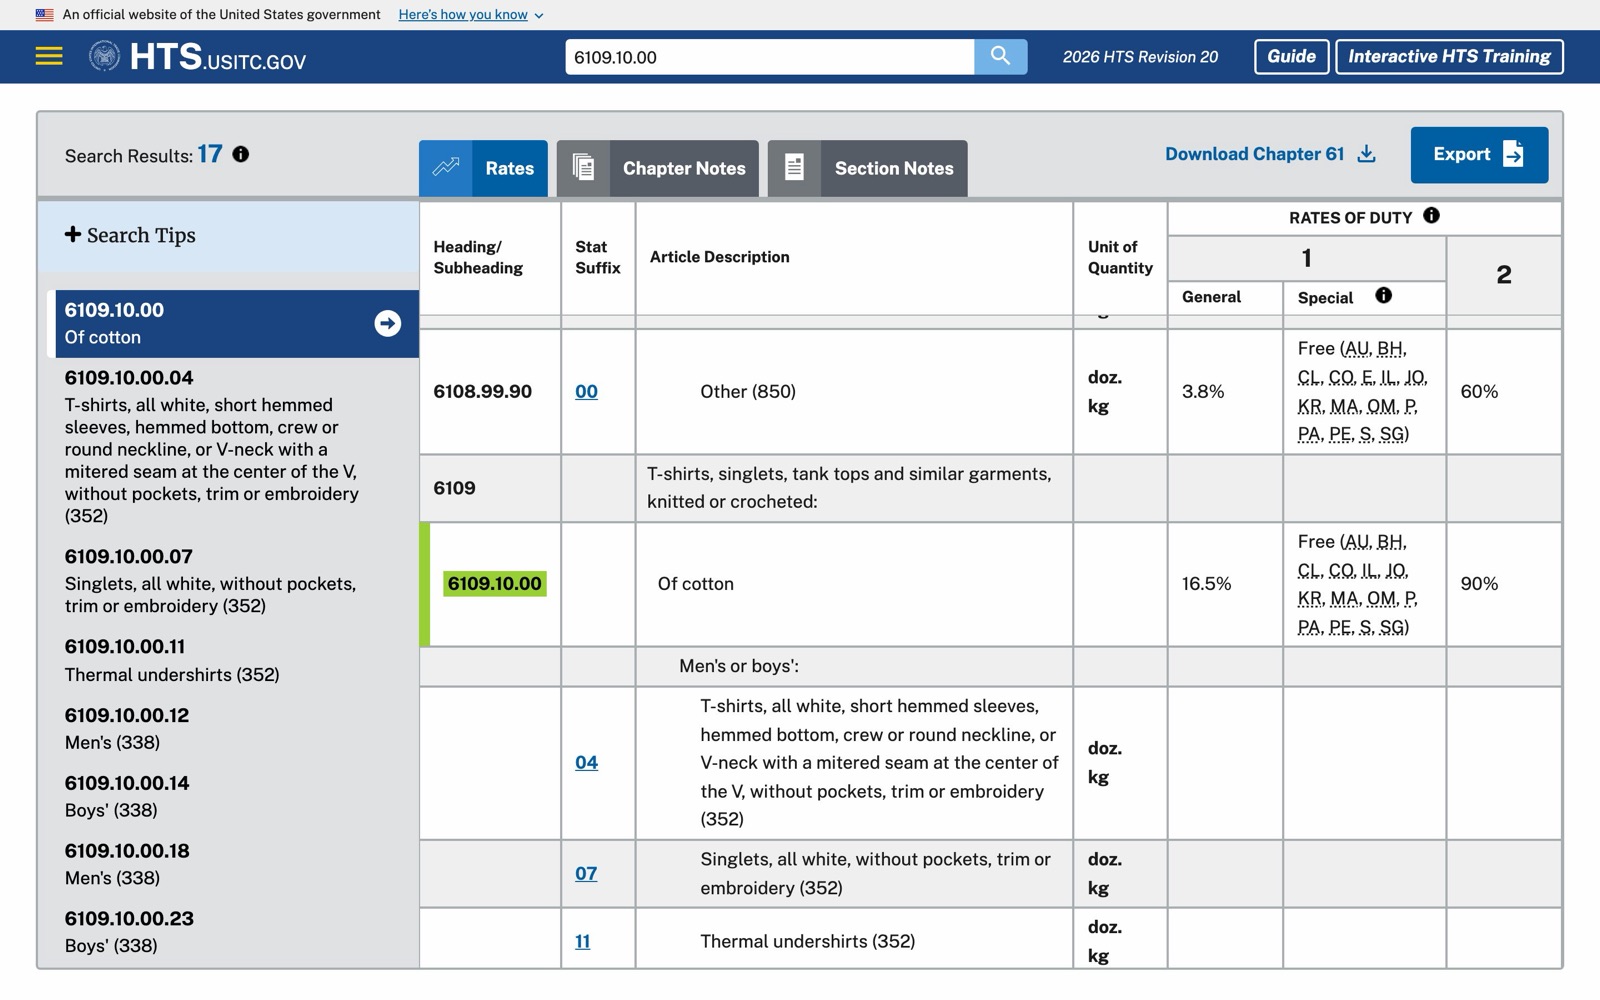
Steps three to five are where the schedule stops being the answer. Step three is origin: a product that qualifies under a trade agreement's rules of origin can enter at the preferential rate, often zero, but only if the importer claims it and can prove it. Preferences are underused; the WTO estimates that only 17% of global imports actually benefit from preferential treatment - WTO. Step four adds duties imposed outside the schedule, which in the United States sit in Chapter 99 of the tariff schedule and in 2026 include the Section 232, 301 and 338 layers described in section 4. Step five adds trade remedies, anti-dumping and countervailing duties that are often specific to individual exporting companies, and any quota that changes the rate once a volume is filled.
Put together, the steps produce answers that no country average could. The table below applies them to two ordinary products entering the United States in October 2026. Every rate comes from the US schedule's own entries, including the Chapter 99 headings for the Section 301 duties on goods of Bangladesh (+10%) and Vietnam (+12.5%) and the Section 232 entries for passenger vehicles from the EU (15% all-in) and the United Kingdom within its quota (+7.5%) - USITC. Treat it as an illustration rather than a customs ruling: company-specific trade remedies and line-level exemptions can change the result for any real shipment.
| Shipment into the US, October 2026 | MFN rate | Additional duties | Total |
|---|---|---|---|
| Cotton T-shirt from Bangladesh | 16.5% | Section 301, +10% | 26.5% |
| Cotton T-shirt from Vietnam | 16.5% | Section 301, +12.5% | 29.0% |
| Cotton T-shirt from Portugal (EU) | 16.5% | None: the MFN rate already exceeds the 10% cap | 16.5% |
| Mid-size car from Germany (EU) | 2.5% | Section 232, all-in rate of 15% | 15.0% |
| Mid-size car from the UK, within quota | 2.5% | Section 232, +7.5% | 10.0% |
| Mid-size car from a country without a deal | 2.5% | Section 232, +25% | 27.5% |
The table makes a point that the averages hide. The EU's T-shirt pays less than Bangladesh's not because the EU has a lower country rate in any meaningful sense, but because the EU's Section 301 duty is defined net of the MFN rate, and clothing already carries a high MFN rate. A car, with a low MFN rate, flips the comparison: the deal partners pay a capped 15% while everyone else pays 27.5%. How to apply this in practice: start every tariff question from the product line, never from the country, and only then aggregate upward if you need a country number at all.
8. Seven traps in tariff data
Tariff data looks precise, with rates printed to one or two decimals, and that precision invites misreading. The traps below are the ones that most often produce wrong conclusions, and every one of them has a concrete example in this year's data. Most of them are traps Portolan had to engineer around in its own tariff layer, described in the next section, so the examples come from real numbers rather than hypotheticals.
The first trap is reading the schedule as the border. The WTO's 2026 tariff profiles still list the US simple average at 3.3%, unchanged from the year before, because the MFN schedule does not include any of the Chapter 99 duties - WTO. The US collected 7.65% of import value in 2025. Any comparison of 2025 or 2026 American tariffs built on schedule measures is comparing the wrong objects.
The second trap is reading an announcement as a collection. Statutory rates are what the law says; collected rates are what customs takes after exemptions, exclusions and behavior. Chinese goods faced an announced additional 145% in April 2025 but paid 47.92% in the highest month on record, and the gap persists in 2026: the average tariff in force on Chinese goods stood at 35.2% in August, while the duty actually collected on them ran near 21%. The Hoover Institution's interview with economist Brent Neiman of Chicago Booth makes the same point from his own research, that actual tariff rates have run at about half the headline rates; the discussion of how to measure tariff rates starts at 13:21.
The third trap is trusting a weighted average to show protection. The WTO and UNCTAD's own practical guide warns that import-weighted averages "under-weigh high tariffs and would give zero weight to prohibitive tariffs" - WTO and UNCTAD. The bias can also run the other way: the WTO computes its weighted average "assuming all imports are levied the MFN rate", so goods that actually entered under a trade agreement or inside a low-duty quota are counted at the full MFN rate. That is why Korea's weighted average for agricultural products, 83.2%, is higher than its simple farm average of 57.0%.
The fourth trap is mistaking a change of definition for a change of policy. Long tariff series are often spliced from different sources, and the sources measure different things. In Portolan's own world series, the World Bank's effectively applied rates run through 2022 and the WTO's trade-weighted MFN rates take over from 2023. Measured on the same year, the two differ by a median of 2.2 points, so India appears to jump from 4.59% to 12.00% and Morocco from 4.23% to 13.90% at the boundary with no policy change at all; the map marks that seam rather than presenting one continuous line.
The fifth trap is forgetting that some duties cannot be averaged cleanly. A specific duty, such as an amount per kilogram, has to be converted to an ad valorem equivalent before it can enter an average, and that equivalent moves with prices and with the reference year chosen, so "the calculated AVEs could have changed because new reference years for imports are used every issue" - WTO. The problem is concentrated in food: in the same WTO tables, 66.2% of Switzerland's agricultural subheadings and 42.4% of the United States' carry non-ad valorem duties. Quotas add another layer, since the same product pays a low rate inside the quota and a prohibitive one outside it.
The sixth trap is assuming the source is clean. The World Bank's tariff series contains one-year values no schedule ever contained: Nepal at 421.5% in 2008 between 13.29% and 12.65%, Palau at 118.21% and Bermuda at 103.17% in 2019, the United States at 13.78% in 2019 between 1.59% and 1.52%, and Sudan at 0% in 2020 and 2021 while its MFN rate was 25.17% - World Bank. Drawn naively, that one Nepalese value lifted the average across economies that Portolan's map computes for 2008 from about 5.9% to 8.55%. Portolan holds such values out with a published rule and names them, rather than deleting them silently.
The seventh trap is treating collected duties as final. A collected rate is only as final as the law behind it. The $166 billion of IEEPA duties that CBP now has to refund were collected, recorded and counted in every 2025 statistic, including the Census series in section 5; between May and July 2026 refunds exceeded new collections in the Treasury's accounts - US Treasury. The 2025 figure of 7.65% therefore measures what importers paid at the border that year, not what they will end up having paid. Why all seven matter is the same reason: each one turns a correct number into a wrong conclusion. How to apply them is a checklist question for every figure: which measure, which year, which source, and has anything since changed what it means.
9. How Portolan measures tariffs and keeps them current
The tariff layer of the Portolan map colors each economy by the tariff it charges on imports, and it is built from the same public sources this guide cites, combined with explicit rules. For most economies the series runs from the World Bank's effectively applied rate, which covers 1988 to 2022, into the WTO's trade-weighted MFN rate for 2023 to 2025. The United States is the exception: from 2010 its series is the duty collected as a share of imports from the Census Bureau, because no schedule-based measure reads the duties it levies outside its schedule. The map's data provenance page documents every feed and its refresh schedule.
Several rules sit on top of the raw data, and each corresponds to a trap in the previous section. The map names the measure in force for the year on screen and marks the seam between the World Bank and WTO series. Implausible one-year source values, like Nepal's 2008 figure, are held out and disclosed by name. The US panel shows the newest month the Census Bureau has published next to the last complete year: in mid-October 2026, August's 6.87% alongside 2025's 7.65%. The timeline beneath the map records the tariff actions themselves, 187 dated tariff actions from 1930 to 2026 when this guide was written, each with its source, and it merges a live feed of US tariff proclamations from the Federal Register with a hand-verified record of the milestones and non-US measures that no feed carries.
The tariff layer on the Portolan map
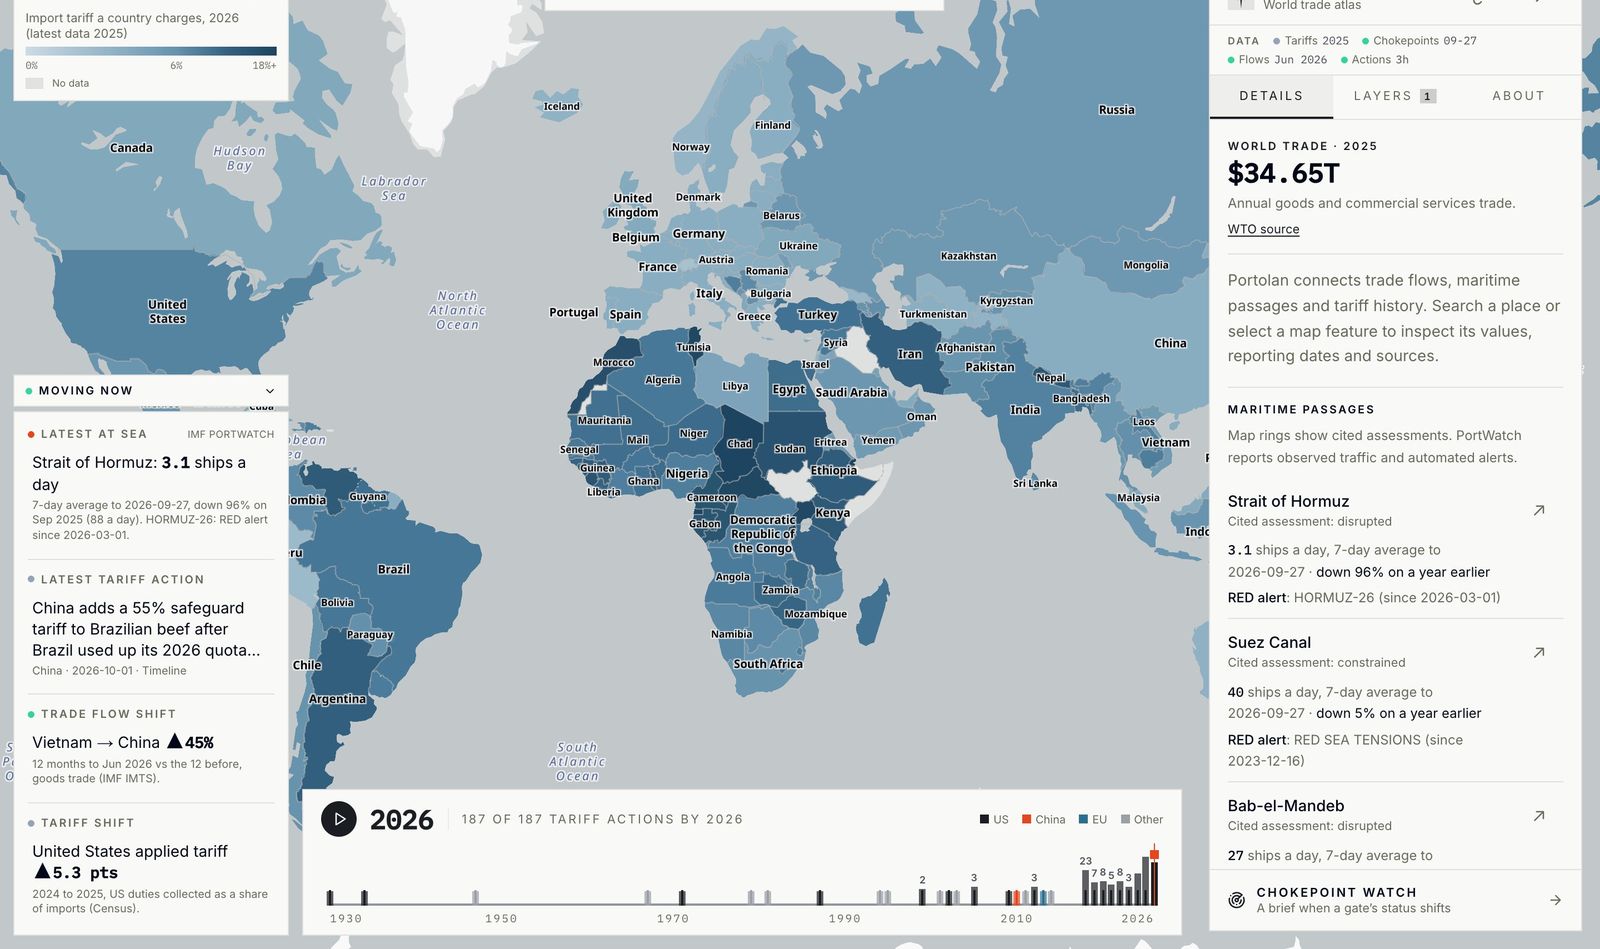
Keeping that current is a matter of scheduled reads against the publishers, not of rewriting numbers by hand. The composed tariff record is refreshed hourly from sources cached for a week, the Census duty series daily, and a response is only replaced when the new read succeeds, so a failed upstream never overwrites a good figure with an empty one. An AI agent does much of that day-to-day work: Portolan is built and run on Founden, which Portolan's founder also runs. The rule the agent works under is the one set out in a field guide to why AI-built apps corrupt data, that a model's output is a sample and not a fact, which is why no rate on the map or in this guide was written by a model; every figure is fetched from the agency that publishes it and can be traced back to it. Checking model answers is paid work in its own right: AI labs pay accountants, analysts and tax specialists by the hour to check a model's answers in their field, and AITraining.jobs, a sister company of this site, lists those remote finance roles with their live pay.
The design choice behind all of this is the one argued throughout this guide: there is no single tariff rate, so an honest instrument has to say which one it shows. Where the public data stops, such as an economy no tariff source has reported for a year, the map shows no color rather than inventing one. For readers who want the relationships behind the rates, each economy's dossier on the map lists its largest partners, and our earlier analysis of the 2026 chokepoint crisis covers the physical side of the same trade routes the tariffs tax. The practical habit the map is built to teach is the one this guide argues for: before quoting an economy's tariff, open it and read which measure its number is.
10. What to watch through early 2027
The tariff landscape of October 2026 is unusually provisional. Several of the layers described above are under legal challenge, several have announced but not yet effective changes, and at least one new statute requires action within days. Knowing the calendar is the difference between quoting a rate and quoting a rate that will still be true next month.
The nearest deadline passed without a new duty. The Sanctioning Russia and Iran Act of 2026, signed on September 18, orders tariffs of up to 500% on Russian goods and up to 100% on goods from the largest buyers of Russian oil and gas - White House, and required the measures within 30 days of enactment, that is by October 18, 2026 - Morgan Lewis. On October 16 an executive order set those duties and, in the same text, waived every one of them with no end date, so none is collected - White House. The waiver stands until the President or the Secretary of State decides further action is appropriate, and because the second clause targets major buyers rather than Russia itself, lifting it could change the US tariff on large trading partners overnight.
The legal calendar is the second thing to watch. The Court of International Trade heard the challenge to the forced-labor Section 301 duties on September 30, and a ruling against them would remove the layer that replaced the Section 122 surcharge. The Federal Circuit has yet to decide the appeal on Section 122 itself and the government's appeal of the universal IEEPA refund orders. Separately, the Section 301 investigations into "structural excess capacity" opened in March 2026 against 16 economies, including China, the EU, Japan, Korea, Mexico, India and Vietnam, have produced no determination yet - Federal Register; hearings closed in May - ICPA. Any of these could reset rates for dozens of partners at once.
The third group is scheduled changes. The US-China truce now runs to January 10, 2027, and the "30-for-30" tariff cuts have lists but no rates or dates - Office of the US Trade Representative. On November 10 the 178 exclusions from the China Section 301 duties, due to lapse on November 9, were extended to the same calendar, through January 9, 2027 - Federal Register, and so was the suspension of the Section 301 fees on Chinese ships calling at US ports - Federal Register. The polysilicon tariff starts on December 4. The USMCA, which the United States declined to renew for a new 16-year term in July, now faces annual reviews, and the consultation for the 2027 review opened on October 5 - Federal Register. The statutory end of duty-free treatment for low-value parcels arrives on July 1, 2027.
On the data side, later releases have sharpened the picture. The Census Bureau's August trade figures, the first full month under the forced-labor duties, put the collected rate at 6.87%, up from July's 6.45%, and its September figures put it at 6.49%: $22.9 billion of duty on $353.6 billion of imports. And on October 8 the WTO raised its forecast for merchandise trade growth in 2026 to 3.9%, from the 1.9% of its March outlook, as trade in AI-related goods offset the war in the Middle East, after growth of 4.2% in 2025 - WTO. The Portolan map's timeline and the US tariff panel update as these land, so the live map is the place to check whether any figure in this guide has moved.
11. Which number to use: a decision framework
Every section of this guide reduces to one discipline: match the measure to the question. A tariff figure is not wrong because it is low or high; it is wrong when it answers a different question from the one being asked. The table below is the short version, pairing the common questions with the measure that answers them and the place to find it.
| If your question is | Use this measure | Where to find it |
|---|---|---|
| How protectionist is a country's policy? | Simple average MFN applied, plus the bound average | WTO Tariff & Trade Data, World Tariff Profiles |
| What does a typical shipment into a market pay? | Trade-weighted average, then check preferences for your origin | WTO, World Bank WITS |
| What do goods from one country pay in the US today? | Duty collected as a share of imports, by partner | US Census Bureau trade data |
| What will current US law cost, before importers adapt? | Statutory average effective rate | Yale Budget Lab, Tax Foundation |
| What duty will my product pay? | The tariff line, plus extra duties, remedies and quotas | The destination's own schedule (HTS, TARIC, UK Trade Tariff) |
The deeper lesson is about what kind of object a tariff has become. For most of the WTO era, a country's tariff was a slow-moving schedule, and a single average was a reasonable summary of it. In 2026, at least for the world's largest importer, the tariff is a stack of statutes applied product by product and country by country, changed by proclamation, court ruling and negotiation within weeks. Averages still have their uses, but only when they say exactly what they average, and the most reliable single figure for the United States is now the one customs actually collects, because it integrates everything else.
The practical close is a checklist you can apply to any tariff number you meet: name the measure, the year and the source; ask whether it reads the schedule or the border; check whether the product, the origin or a court ruling could change it; and when the stakes are real, go down to the tariff line. That habit turns a confusing stream of tariff headlines into something you can verify, which is the same purpose the Portolan map serves for the trade system as a whole.
This guide reflects tariff data and US trade law as of October 5, 2026. Tariff rates, legal challenges and trade agreements are changing unusually quickly, so verify current figures against the linked primary sources before relying on them for a decision.
Updated 12 October 2026 with the Census Bureau's August figures and the WTO's October forecast.